Engineering intelligence. On your PC.
Complex data.
Clearer decisions.
Statistics, wafer maps, local AI and Python in one connected engineering workbench. See the pattern. Follow the question. Keep the insight.
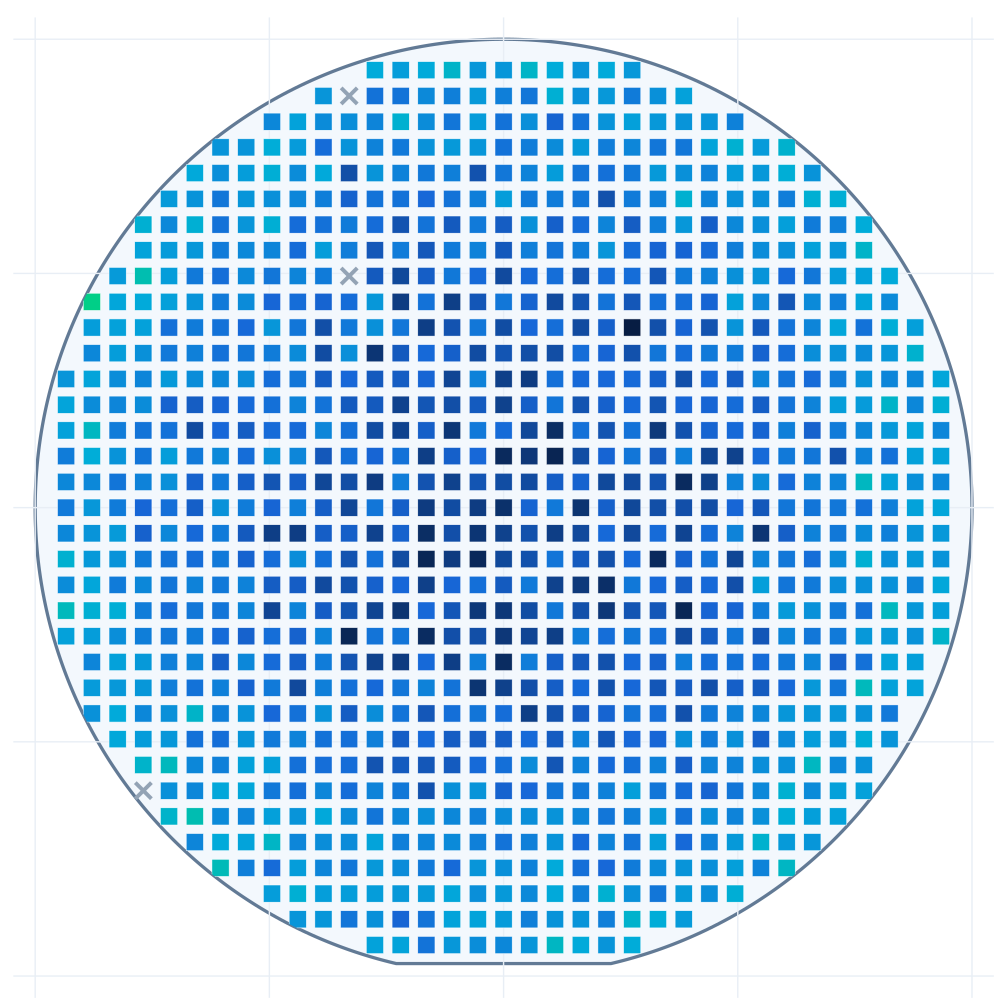
One connected engineering environment
A closer look
See more.
Understand more.
From distributions to die-level patterns. Move between the views that bring your engineering question into focus.
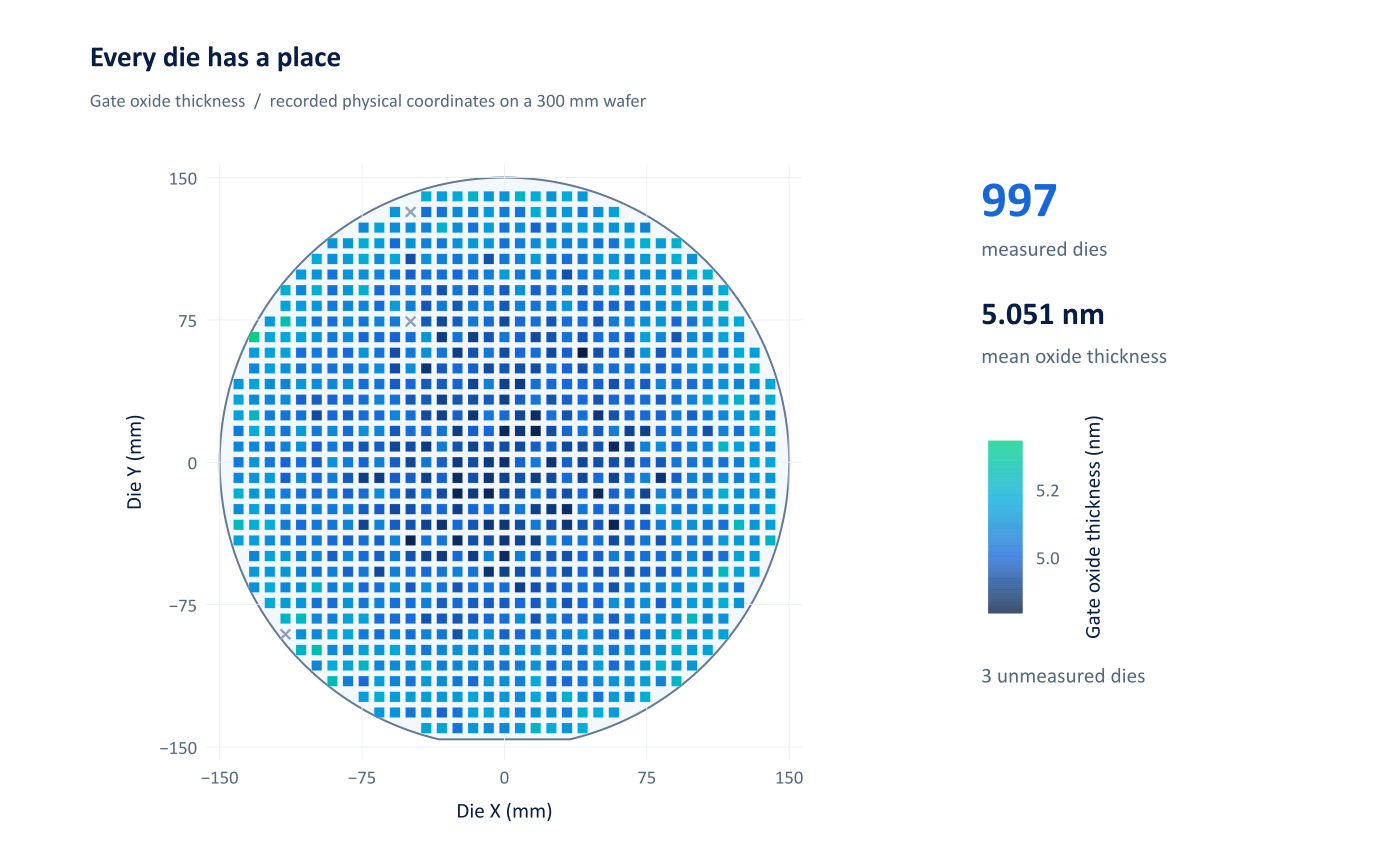
Read the spatial pattern, then check the parameter, units and wafer identity. This demonstration preserves physical die coordinates.
Inside Numetiva
Every view.
A new way in.
Explore the workbench data: process capability, predictive response and die-level patterns. Open a chart to see the detail.

Vector view from a verified final 1501 application scene; see Terms & validation for provenance and test scope.
Your work, connected
From the first column
to the final decision.
Explore a measurement. Build an analysis. Turn the useful steps into a workflow you can return to.
Explore visual workflows- 01
Start with a better view.
Explore distributions, compare groups and connect a visible pattern with its underlying measurements.
- 02
Keep the analysis together.
Move between charts, fitted models, profilers and their related text in the project output navigator.
- 03
Make it part of the workflow.
Save the sequence, return to a Python script and take a clear chart or report into your next review.
AI, within the workbench
A little help.
A lot more possibility.
Ask in plain language. Inspect the Python draft. Run it with your worksheet. Numetiva AI stays connected to the work you are doing.
Your question is
a useful starting point.
Plot relationships. Explore a model. Bring an error back into the conversation and work through the next step.
“Plot tool wear against vibration, and add a quadratic fit.”

Turn the question into a script you can inspect.
import numpy as npimport matplotlib.pyplot as pltx = df["Tool_Wear_um"]y = df["Vibration_RMS_g"]ax.scatter(x, y)fit = np.polyfit(x, y, 2)Local by design
Your data.
Your environment.
Your workbench.
Run engineering analysis close to the data, with local statistical tools, an offline AI option and a Python workbench on your Windows PC.
Explore local operationBring your engineering question.
Explore how Numetiva fits your data, workflow and review requirements.